Author Archives: Livia Clarete

Week 8: March 27 – Conceptualization

In Search of Zora/When Metadata Isn’t Enough: Rescuing the Experiences of Black Women Through Statistical Modeling

The authors searched for Alice Walker, who searched for Zora Neale Hurston, in an article that encompasses a generation of searching for cultural and gender visibility in the academic realm related to African American women’s authorship. The research method is based on both quantitative and qualitative analyses of 800,000 documents from the HathiTrust and JSTOR databases. Full article available here.

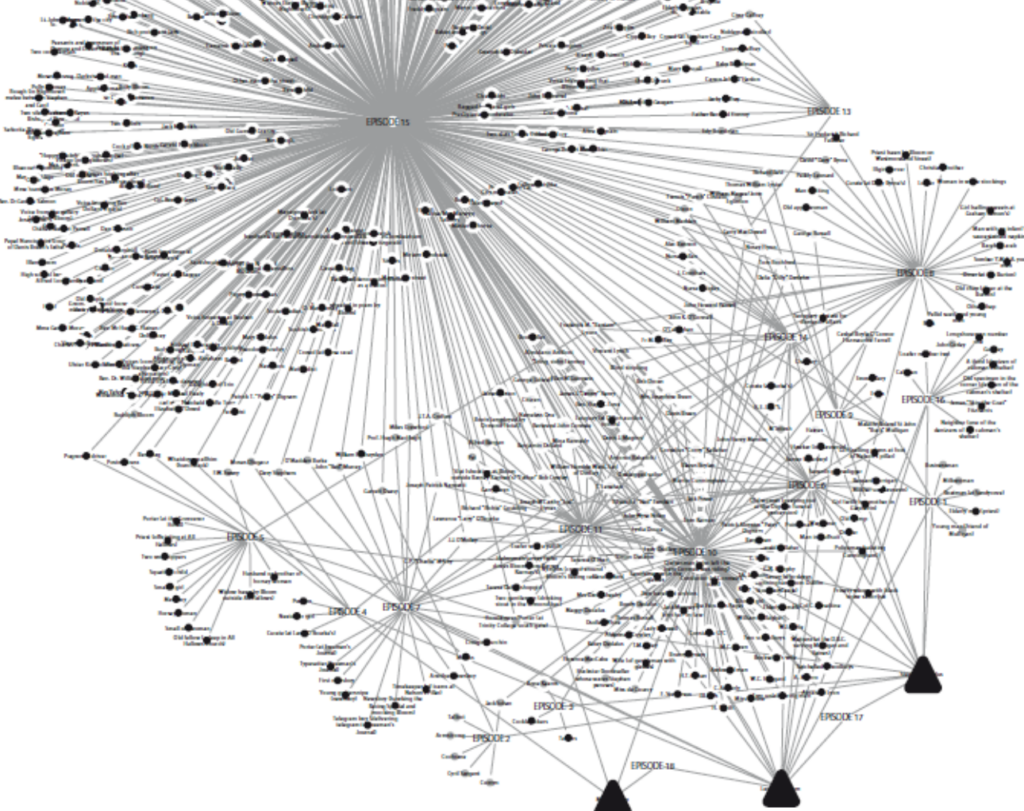
The research is based on Standpoint Theory, a critical conceptual framework intended to uncover knowledge for both reproducing and dismantling social inequality (Collins, 1990, 1998). This approach encompasses the search, recognition, rescue, and recovery (SeRRR), focusing on utilizing digital technologies to engage with intersectional identities. The authors establish three goals: identifying themes related to African American women using topic modeling, using the identified themes to recover unmarked documents, and visualizing the history of the recovery process.

They argue that social science would greatly benefit from digital technologies, such as big data, speech recognition, and other initiatives like The Orlando Project (2018), the Women Writers Project (Wernimont, 2013, p. 18), and the Schomburg Center’s digital library collection of African American Women Writers of the 19th Century (The New York Library, 1999). These projects challenge dominant power narratives by shedding light on new perspectives and dynamics of minority groups whose history has been overshadowed by the triumphalism of American capitalism, which presents an incomplete view of history from various perspectives.

They emphasized the importance of their quantitative approach over rich and descriptive qualitative research, aiming to create a repository of work that brings more visibility to a different side of the story, which is often uncovered through traditional approaches. They summarized their method in the image below.

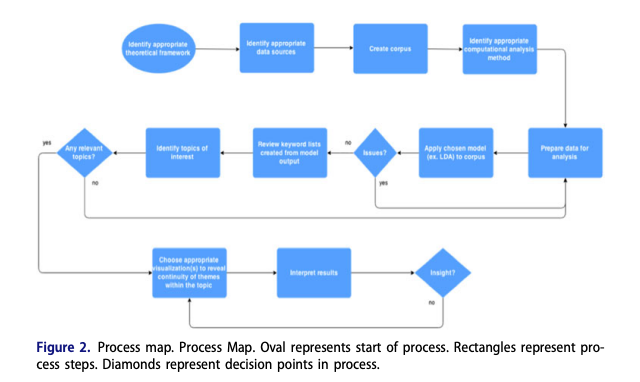
The data collection used the string line (black OR “african american” OR negro) AND (wom?n OR female OR girl) within 800,000 documents from the HathiTrust and JSTOR databases spanning the years 1746 to 2014.

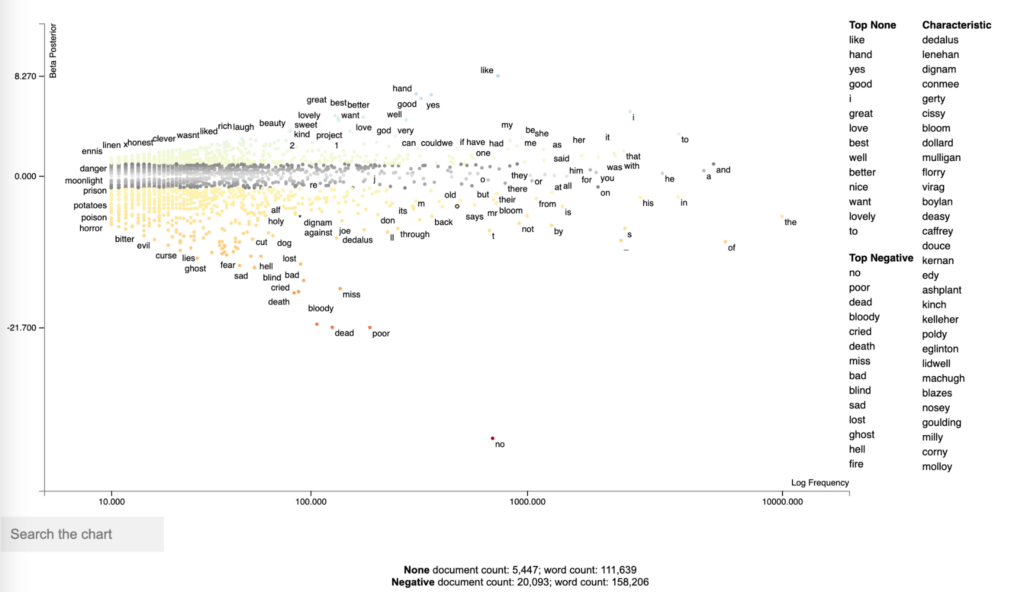
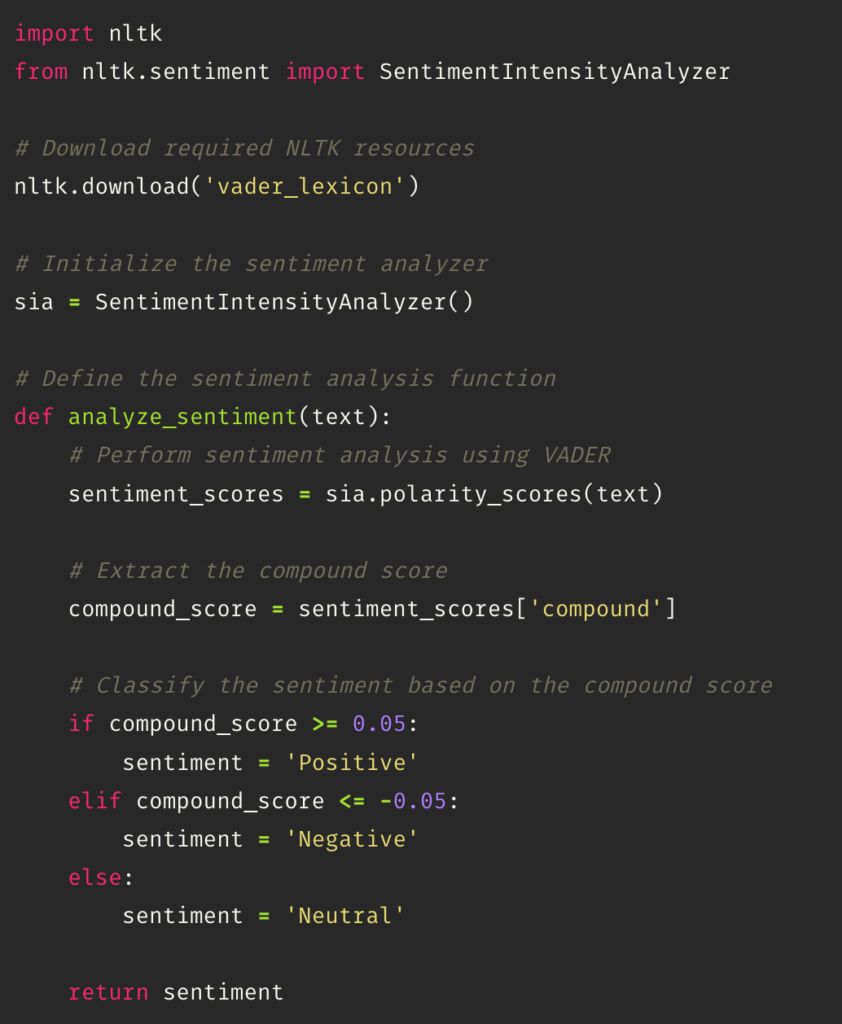
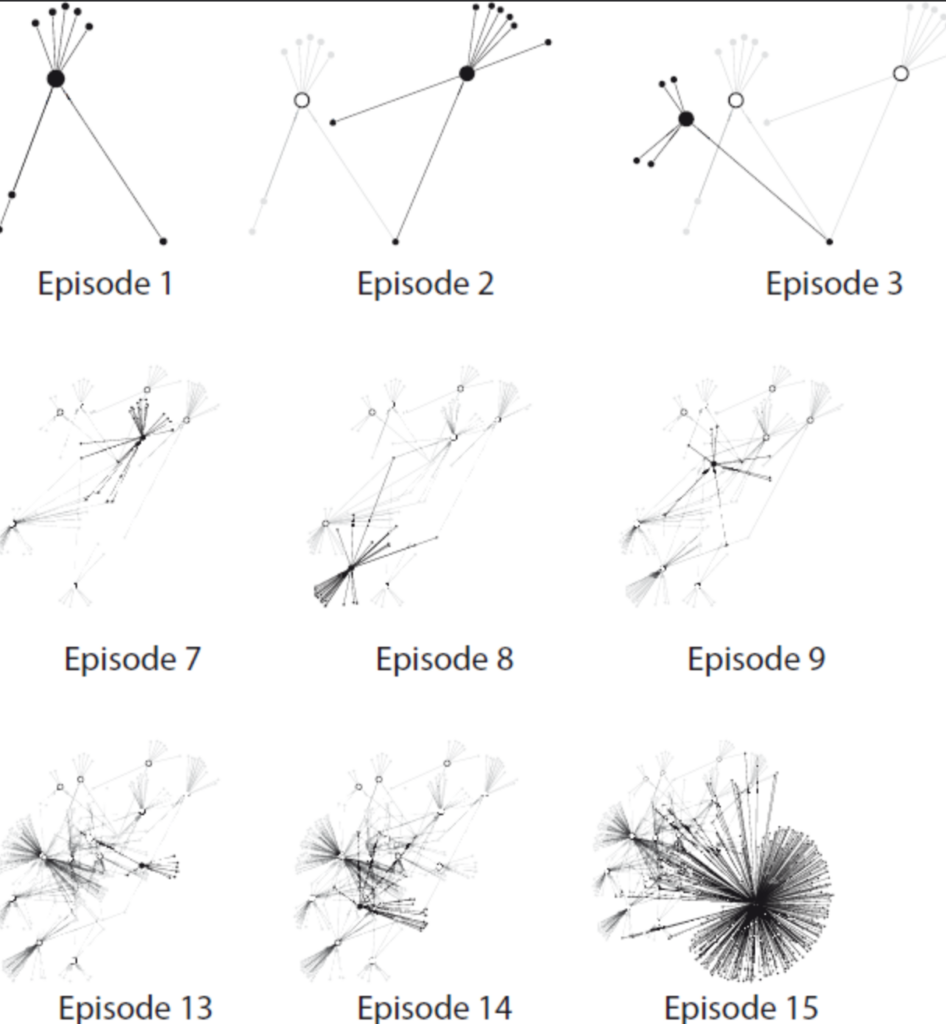
In terms of the analysis method, the authors employed a statistical topic modeling approach to identify documents discussing the experiences of Black women. They utilized a Latent Dirichlet Allocation (LDA) topic modeling technique (Blei, 2012), which clusters words based on the probability of their occurrence across documents using Bayesian probability. Each cluster is referred to as a topic.

They applied the SeRRR method to structure the search and the analysis. The first step is Search and Recognition of the results that are of interest to the Black woman content. In this step, they found 19,398 documents “authored by African Americans based on the metadata with known African American author names and/or phrases such as “African American” or “Negro” within subject headings”: 6,120 of these documents were within the HathiTrust database and 13,278 were within the JSTOR database.

In the second step, the Rescue, they perform a topic analysis in the 19,398 documents. They ended up with 89 initial topics that were reviewed by 5 team members individually – as described in the table below. They used the method of “distant reading”, which can be interpreted as skimming the documents, but focusing on the titles.

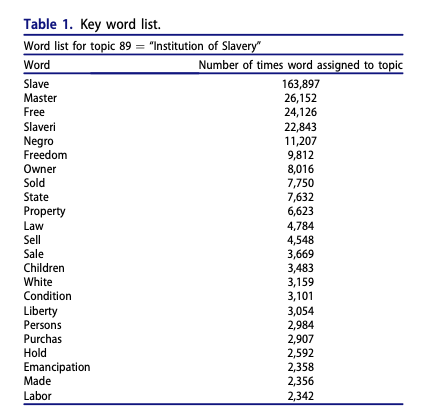
They also developed a method called “intermediate reading” to reflect their reading process that ranges in between the traditional qualitative rich methods and the distant reading of topic modeling. The ultimate goal of this method is to validate the topics and support the quality of the results. The closed this step with a close reading of some full documents for several of these titles.

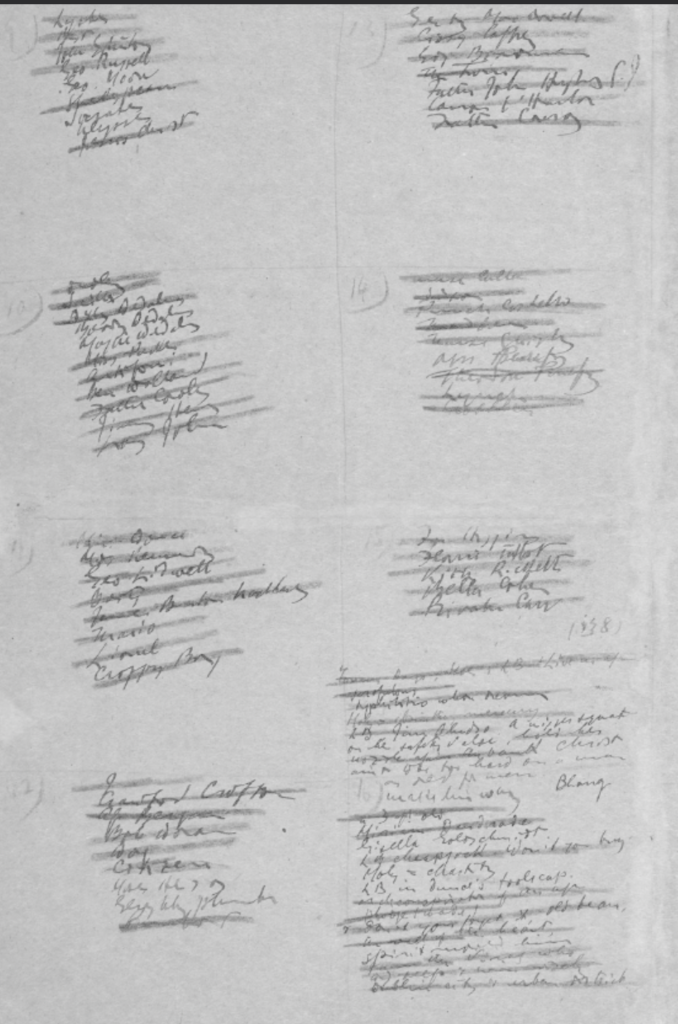
The third step is Recovery. They successfully rescued and recovered 150 documents previously unidentified related to Black women, including a poem written in 1920 called Race Pride by an African American woman named Lether Isbell.

In conclusion, this article successfully not only applied a research method, but they also contributed to enriching the research repo metadata and making new documents accessible to the academic community. 

References

Nicole M. Brown, Ruby Mendenhall, Michael Black, Mark Van Moer, Karen Flynn, Malaika McKee, Assata Zerai, Ismini Lourentzou & ChengXiang Zhai (2019): In Search of Zora/When Metadata Isn’t Enough: Rescuing the Experiences of Black Women Through Statistical Modeling, Journal of Library Metadata, DOI: 10.1080/19386389.2019.1652967 To link to this article: https://doi.org/10.1080/19386389.2019.1652967

Note: this blog post about “How they did it is quite interesting” – here.

Ulysses Interactive Visualization with scattertext (HDTMT)

How did they make that?

Inspired by the Book review Ulysses by Numbers by Eric Bulson, I have created a visualization of a sentiment analysis of the novel Ulysses. The visualization can be found here. The code for the analysis and the viz plotting is here.

This visualization plots the words based on the frequency (X axis), and shows the top positive and negative words in a sidebar table with related characteristics (adjectives). The Y axis displays a score computed based on the sentiment categories (‘Positive’ and ‘Negative’).

The visualization is interactive, allowing us to search specific words, and retrieve the part of the text where the word occurs.


This HDTMT is intended to show how to run this analysis, and it’s divided into 5 sections, as follows:

  • Downloading and importing Ulysses data
  • Tokenizing data into sentences
  • Perform sentiment analysis
  • Plotting the visualization with scattertext
  • Deploying the html into github pages
  • Next steps and improvements


Downloading and importing Ulysses data

We start by importing “Requests”, the Python library that makes HTTP requests and will connect us to the Github repo where the Ulysses data is stored – here. The data comes from the Gutenberg EBook from August 1, 2008 [EBook #4300], updated on October 30, 2018.


Tokenizing data into sentences

After importing the data, the next step involves cleaning and tokenizing the text into sentences. The data might contain noise such as line breaks (‘\n’) and misplaced line breaks (‘\r’). The function first joins the sentences with misplaced line breaks (‘\r’) to ensure they are connected properly. Then, it tokenizes the text into sentences by splitting the string using ‘\n’, line breaks, and punctuation marks as delimiters. This process ensures that the text is properly segmented into individual sentences for further analysis.


Perform sentiment analysis

The next step is performing a sentiment analysis that classifies the text into positive, negative, and neutral tone. This task is performed using the class SentimentIntensityAnalyzer from the nltk.sentiment module in NLTK (Natural Language Toolkit). 

The SentimentIntensityAnalyzer uses a lexicon-based approach to analyze the sentiment of text by calculating a compound score. The compound score is an aggregated sentiment score that combines the positive, negative, and neutral scores. The compound score ranges from -1 (extremely negative) to 1 (extremely positive). If the polarity is greater than 0.05 it can be considered positive; lower than 0.05 is negative, and the values in between are neutral. 


Plotting the visualization with scattertext

The next step is to import scattertext, a Python library that analyzes and creates an html file. The library receives a specific data type, which is a corpus that is created by using the CorpusFromPandas function. This takes a Pandas DataFrame (t) as input and specifies the category column (‘sentiment’) and text column (‘text’). The whitespace_nlp_with_sentences tokenizer is used for text processing. The corpus is then built, and the unigram corpus is extracted from it.

Then, it creates a BetaPosterior from the corpus to compute term scores based on the sentiment categories (‘Positive’ and ‘Negative’). Next, the get_score_df() method is called to get a DataFrame with the scores. The top positive and negative terms are printed based on the ‘cat_p’ (category posterior) and ‘ncat_p’ (non-category posterior) scores, respectively.

The produce_frequency_explorer function generates an interactive HTML visualization of the corpus. It specifies the corpus, the positive category, the name for the negative category, and the term_scorer as the BetaPosterior object. The grey_threshold parameter sets a threshold for terms to be displayed in gray if they have a score below it.

Finally, the resulting HTML visualization is saved to a file named ‘ulysses_sentiment_visualization.html’ using the open function.


Deploying the html into Github pages

Lastly, we can deploy the html output from the scattertext visualization into a github page. We start by creating a Github repo. Then, uploading the html. Finally, going to settings and changing the deployment source – I’m using from branch, and main/ root in this case.

I’m pointing my Github pages into my alias, livia.work, but you can also use the Github service. This tutorial by professor Ellie Frymire has more details about how to perform the deployment step that can be helpful – here.

Book review: Ulysses by Numbers by Eric Bulson

Bulson, Eric Jon. Ulysses by Numbers. Columbia University Press, 2020. cuny-gc.primo.exlibrisgroup.com, https://doi.org/10.7312/buls18604.

Summary: Eric Bulson employs a quantitative and computational approach to analyze the novel “Ulysses” by James Joyce. His objective is to gain insights into the novel’s structure and themes through the application of statistical methods. By examining the repetitions and variations of numerical patterns within the text, Bulson aims to uncover a deeper understanding of the novel. 

My experience: It was an interesting, but challenging read for me. I did skim through the “Ulysses” by Joyce on multiple occasions, but I never fully immersed myself in its pages. Now, I’m feeling more open to giving it a try at some point in the future. Having that in mind, I mostly focused on understanding the method Bulson used to convey his message.

Eric Bulson is a professor of English at Claremont Graduate University. He got his PhD in English and Comparative Literature from Columbia University. His research interests goes on a range of subjects including Modernism, Critical Theory, Media Studies, World Literature, Visual Storytelling, and British and Anglophone Literature from 1850 to 2000.

Ulysses by Numbers highlights the presence of numeric patterns throughout “Ulysses,” asserting their role in shaping the novel’s structure, pace, and rhythmic flow of the plot. He suggests that Joyce’s deliberate use of numbers is purposeful, enabling him to transform the narrative of a single day into a substantial piece of artwork. Bulson explores the intentionality behind Joyce’s numerical choices, emphasizing how they contribute to the book’s richness and complexity. Additionally, the tone of Bulson’s analysis combines elements of playfulness and exploration, adding an engaging dimension to the discussion.

He emphasizes he will be focused on the “use numbers as a primary means for interpretation“, to make the point that a quantitative analysis is the missing point to compose a “close reading as a critical practice”. He proposed it as an additional method to the traditional literature review that focused on the text.

“Once you begin to see the numbers, then you are in a position to consider how it is a work of art, something made by a human being at a moment in history that continues to recede into the past. We’ll never get back to 1922, but by taking the measurements now, we are able to assemble a set of facts about its dimensions that can then be used to consider the singularity of Ulysses and help explain how it ended up one way and not another.”

Bulson recognizes that literature critique based on computational methods is still under development, and not quite popular yet. The utilization of computers in literary analysis is a relatively modern phenomenon, considering that the majority of such processes were conducted manually until a few centuries ago. The practice of using numbers to elaborate narratives was common until the 18th century in the work of Homer, Catullus, Dante, Shakespeare, and others. However, the rationalism of the upcoming area covered up this practice. Only in the 1960s did the search for symmetry and numerological analysis reemerged, culminating in the method of computational literary analysis (CLA).

Bulson explains that he differs from the usual approach to adapt the use of small numbers in his analysis. Firstly, his analysis is based on samples. It means that instead of analyzing the entire novel the author selects specific sections. Secondly, he recognizes that he applies basic statistical analysis. Despite the simplicity of his analysis, his goal is to make literature more visible. 

In terms of sources, he goes deep into finding the sources of data he considered in this analysis:

“Measuring the length of the serial Ulysses, simple as it sounds, is not such a straightforward exercise. In the process of trying to figure this out, I considered three possibilities: the pages of typescript (sent by Joyce to Ezra Pound and distributed to Margaret Anderson, editor and publisher of the Little Review, in the United States), the pages of the fair copy manuscript (drafted by Joyce between 1918 and 1920 and sold to the lawyer and collector John Quinn), and the printed pages of the episodes in the Little Review (averaging sixty-four per issue).”

It’s interesting to notice how he illustrates his arguments with both handwriting and drawings with graphs and charts, which encompasses the idea of a craftwork mixed with technological visualizations.

In terms of the novel’s structure, Bulson examines the presence of 2’s and 12’s, such as the address “12, rue de l’Odéon” and the year of publication (1922), among other recurring patterns. Additionally, he delves into the number of paragraphs and words in the text, and explores the connections between them. Through one particular analysis, he determines the level of connectivity among the chapters, identifying Chapter 15 as having the highest number of nodes and being the most connected to other chapters, which he refers to as an “Episode.” Chapter 15 consists of 38,020 words and 359 paragraphs. Another significant episode is Chapter 18, which contains the second-highest number of words (22,306) but is condensed into only 8 paragraphs. Chapter 11, on the other hand, has the second-highest number of paragraphs (376) and comprises 11,439 words.

Bulson also examines characters from a quantitative perspective, contrasting the relatively small number of character count in “Ulysses” with other epic works such as “The Odyssey” or “The Iliad.” He uses a visual representation of a network to enhance the understanding of the novel’s scale and structure – highlighting the crowded number of roles in episode 15. 

“Episode 15 arrived with more than 445 total characters, 349 of them unique. If you remove the nodes and edges of episode 15 from the network, Ulysses gets a whole lot simpler . That unwieldy cluster of 592 total nodes whittles down to 235 (counting through episode 14). Not only is a Ulysses stripped of episode 15 significantly smaller: it corresponds with a radically different conception of character for the novel as a whole”.

Moving from the text meta analysis, the authors examine who read the 1922 printed book. Outside of Europe and North America, only Argentina and Australia. In the US, the book was most popular in the West Coast. In the following chapter, he tries to answer when Ulysses was written. He mentioned that the traditional answer is that Joyce began writing the novel in 1914 and finished it in 1921. However, he points out that this is such a simplistic answer. He argues about the nonlinearity of the written process, more fluid and organic, and less structured.

In the final chapter, the author goes back to the content analysis, bringing a reflection that could retreat himself “after reducing Ulysses to so many sums, ratios, totals, and percentages, it’s only fair to end with some reflection on the other inescapable truth that literary numbers bring: the miscounts”. He refers as “miscounts” any bias or issues in terms of data collection of analysis.However, he defends the method by saying that literary criticism is not a hard science, and imprecisions, vagueness and inaccuracy is actually part of the process. Also, theories based on small samples are popular in historical and social analysis, and his work should not be discredited because of that. 

“Coming up against miscounts has taught me something else. Far from being an unwelcome element in the process, the miscounts are the expression of an imprecision, vagueness, and inaccuracy that belongs both to the literary object and to literary history. In saying that, you probably don’t need to be reminded that literary criticism is not a hard science with the empirical as its goal, and critics do not need to measure the value of their arguments against the catalogue of facts that they can, or cannot, collect.”

After reviewing the contribution of his perspective, he concludes that “readers might to bridge the gap, Ulysses will remain a work in progress, a novel left behind for other generations to finish. Reading by numbers is one way to recover some of the mystery behind the creative process.”

Weapons of Math Destruction – a deep dive into the recidivism algorithm

Automation has been occupying more space in the productive system in today’s society and algorithms are at the core of it. They are logical sequences of instructions that enable autonomous execution by machines. The expansion of these calculation methods is largely due to the use of software, able to collect a more significant amount of data from different sources. It is embedded into users’ everyday tools such as Google’s search, social media networks, movies and music recommendations of Netflix and Spotify, personal assistants, video games, surveillance, and security systems. 

Computers are much more efficient in replicating endless tasks without committing mistakes. They connect information faster and establish protocols to log input and output data.  They don’t get distracted, tired, or sick. They don’t gossip, or miscommunicate with each other. The Post-Accident Review Meeting on the Chornobyl Accident (1986) reviewed that poor team communication and sleep deprivation were the major issues that caused the disaster. 

In 2018, the project Blue Brain relieved brain structures are able to process information in up to 11 dimensions. Computers, on the other hand, process zillions of dimensions and are able to unhide patterns that the human brain could not imagine. The concept of big data goes beyond the number of dataset cases. It also involved the number of features/ variables able to describe phenomena. 

Of all the advantages of computers, the most important one is their inability to be creative – at least so far. If I go to bed trusting that my phone is not planning revenge or plotting against me with other machines is because computers don’t have their own wills. Computers don’t have an agenda. Human beings do. Public opinion has become more aware of the impact of automation on the global economy. Accordingly, to a Pew Research 2019 study, 76% of Americans believe that work automation is more likely to increase inequality between rich and poor people, and hurt workplaces (48%). 85% of them favor limiting machines to dangerous or unhealthy jobs. 

Computers uncover patterns; they don’t create new ones. Machines use data to find patterns from past events, which means their predictions will replicate the current reality. If the reliance is on algorithms, the world will continue as it is. In “Weapons of Math Destruction,” Cathy O’Neil adds a new layer to how automation has propagated inequality by feeding biased data to models. “Weapons of Math Destruction” is a book by Cathy O’Neil published in 2016, which explores the societal impact of algorithms. O’Neil introduces the concept of “weapons of math destruction,” referring to big data algorithms that perpetuate existing inequality. She highlights three main characteristics of WMDs: they are opaque, making it challenging to understand their inner workings and question their outcomes; they are scalable, allowing biases to be magnified when applied to large populations; and they are difficult to contest, often used by powerful institutions that hinder individuals from challenging their results. Stretching her own example, if we based educational decision-making policies on college data from the early 1960s, we would not see the same level of female enrollment in colleges as we do today. The models would have primarily been trained on successful men, thus perpetuating gender and racial biases.

This article is intended to explore one of the examples she gives in her book, about the recidivism algorithm. One case to illustrate it was published in May 2016 by the nonprofit ProPublica. The article Machine Bias denounced the impact of biased data used to predict the probability of a convict committing new crimes in a commercial software Correctional Offender Management Profiling for Alternative Sanctions (COMPAS) risk scores. The algorithms used to predict recidivism were logistic regression and survival analysis. Both models are also used to predict the probability of success of medical treatment among cancer patients.

“The question, however, is whether we’ve eliminated human bias or simply camouflaged it with technology. The new recidivism models are complicated and mathematical. But embedded within these models are a host of assumptions, some of them prejudicial. And while Walter Quijano’s words were transcribed for the record, which could later be read and challenged in court, the workings of a recidivism model are tucked away in algorithms, intelligible only to a tiny elite”.

To calculate risk scores, COMPAS analyzes data and variables related to substance abuse, family relationship and criminal history, financial problems, residential instability, and social adjustment. The scores are built using data from several sources, but mainly from a survey of 137 questions. Some of the questions include “How many of your friends have been arrested”, “How often have you moved in the last twelve months”, “In your neighborhood, have some of your friends and family been crime victims”, “Were you ever suspected or expelled from school”, “how often do you have barely enough money to get by”,  and “I have never felt sad about things in my life”. 

According to the Division of Criminal Justice Service of the State of New York 2012, “[COMPAS-Probation Risk]Recidivism Scale worked effectively and achieved satisfactory predictive accuracy”. The Board of Parole currently uses the score for decision-making. Data compiled by the non-profit Vera show that 40% of people were granted parole in 2020 in NY. In 2014, Connecticut reached 67% of the granted parole rate, Massachusetts 63%, and Kentucky 52%.

Former U.S. former Attorney General Eric Holder commented about the scores that “although these measures were crafted with the best of intentions, I am concerned that they inadvertently undermine our efforts to ensure individualized and equal justice […] may exacerbate unwarranted and unjust disparities that are already far too common in our criminal justice system and in our society.” 

Race, nationality, and skin color were often used in making such predictions until about the 1970s, when it became politically unacceptable, according to a survey of risk assessment tools by Columbia University law professor Bernard Harcourt. Despite that it is still targeting underprivileged communities, unable to access welfare. In 2019, African-Americans and Hispanic Origin Groups’ poverty rate was 18.8% and 15.7%, respectively, compared to 7.3% of white people.

The assessment of social projects has shown a decrease in violence among vulnerable communities assisted by income transfer programs in different parts of the world. In the US, the NGO Advance Peace conducted an 18 monthly program targeting members of a community that are at the most risk of perpetrating gun violence and being victimized by it in California.  The program includes trauma-informed therapy, employment, and training. The results show a decrease of 55% in firearm violence after the implementation of the program in Richmond. In Stockton, gun homicides and assaults declined by 21%, saving $42.3 -$110M in city expenses in the 2-year program.

In this sense, using algorithms will propagate the current system. Predictions reinforce a dual society in which the wealthy are privileged to receive personalized, humane, and regulated attention, as opposed to vulnerable groups that are condemned to the results of “smart machines”. There is no transparency in those machines, and no effort from companies or governments to educate the public opinion regarding how the decisions are made. In this regard, a scoring system is created to evaluate the vulnerable. The social transformation will come from new policies directed to reduce inequality and promote well-being. 

Unveiling the Patient Journey: A Gender Perspective on Chronic Disease-Centered Care

Abstract

Healthcare is the industry in which customers want to deal with humans. No machines, they want to connect with real people in their most vulnerable time. In this context, women are more likely to be the center of the patient journey: from taking their loved ones to a doctor’s appointment to being the primary care of kids with chronic diseases (such as asthma).

The burden of care is still under women dealing with unpaid work. However, it’s not any better for men. In 2019, Cleveland Clinic conducted a survey which found that 72% of respondents preferred doing household chores like cleaning the bathroom to going to the doctor; 65% said they avoid going to the doctor for as long as possible; 20% admitted they are not always honest with their doctors about their health. On average, men die younger than women in the United States. American women had a life expectancy of 79 years in 2021, compared to 73 for men (CDC, 2022).

The goal of this research is to explore the gender differences in a patient journey by applying a corpus linguistic approach to create and annotate a dataset about chronic disease in Portuguese and English manually using social media data from Facebook, Instagram, YouTube and Twitter. Then, I’m applying text analysis methods to describe the dataset. Lastly, comparing the classification results of Generative AI to the traditional machine learning text analysis.

This analysis also wondered between the benefits and detriments of performing with such analysis. Despite the investment of language model resources, it’s valuable to use AI to uncover gender inequalities. The final goal is open discussion about how to take the burden from women, and also empowering men to feel comfortable about their own health. It’s also open space to discuss new methods exploring different gender classifications.

Goal: This proposal is intended to describe a study of how corpus linguistic and text analysis methods can be used to support research on language and communication within the context of healthcare using social media data about chronic disease in English and Brazilian Portuguese.

The specific goals evolve:

  1. Performing literature review based on previous studies and benchmark datasets in the healthcare field – process finished.
  2. Creating a dataset with social media posts from 2020 to 2023 in social networks such as Twitter, YouTube, Facebook, and local media channels. The dataset is composed of around 7k posts and specifies the patient’s gender, type of treatment/ medication, number of likes and comments – process already finished: dataset here.
  3. Categorizing the corpus according to gender and the patient journey framework, from initial symptoms to diagnosis, treatment, and follow-up care – process already finished: dataset here.
  4. Documenting the dataset and creating a codebook explaining the categories and the criteria for the categorization process – process already finished: code book and the the connection of the ontologies.
  5. Applying categorization based on GPT3 results – in progress
  6. Comparing the results with the manual classification with GPT3 results

Literature review

Several linguistic analyses and corpus analysis studies have investigated the patient journey in healthcare, exploring different aspects of communication between patients and healthcare providers, patient experience, and clinical outcomes. One area of research has focused on the use of language by healthcare providers to diagnose and treat patients. For example, a study by Roter and Hall found that physicians used a directive communication style, using commands and suggestions, more often than a collaborative communication style when interacting with patients. This style can create a power imbalance between the physician and patient, potentially leading to dissatisfaction or miscommunication. 

Another area of research has investigated patient experience and satisfaction. A corpus analysis study by Gavin Brookes,  and Paul Baker examined patient comments to identify factors influencing patient satisfaction with healthcare services during cancer treatments. They found that factors such as communication, empathy, and professionalism were key drivers of patient satisfaction.

Finally, several studies have investigated the use of language in electronic health records (EHRs) to improve patient care and outcomes. A corpus analysis study by Xi Yang and colleagues examined the use of EHRs and found that natural language processing techniques could effectively identify relevant patient information from unstructured clinical notes.

Overall, the literature on linguistic analyses and corpus analysis studies on healthcare patient journey suggests that communication and language play a critical role in patient care and outcomes. Effective communication between patients and healthcare providers, as well as clear and concise language in patient education materials and EHRs, can lead to improved patient satisfaction, empowerment, and self-management.

Method overview

  • Data collection: collecting data based on keywords on social media;
  • Coding data: using qualitative coding and annotation
  • Data analysis: performing linguistics and statistical analysis 

References

“Doctors Talking with Patients—Patients Talking with Doctors: Improving Communication in Medical Visits.” Clinical and Experimental Optometry, 78(2), pp. 79–80

Yang, X., Chen, A., PourNejatian, N. et al. A large language model for electronic health records. npj Digit. Med. 5, 194 (2022). https://doi.org/10.1038/s41746-022-00742-2

Peterson KJ, Liu H. The Sublanguage of Clinical Problem Lists: A Corpus Analysis. AMIA Annu Symp Proc. 2018 Dec 5;2018:1451-1460. PMID: 30815190; PMCID: PMC6371258.

Adolphs, S, Brown, B., Carter, R., Crawford, C. and Sahota, O. (2004) ‘Applying Corpus
Linguistics in a health care context’, Journal of Applied Linguistics, 1, 1: 9-28

Adolphs, S., Atkins, S., Harvey, K. (forthcoming). ‘Caught between professional requirements and interpersonal needs: vague language in healthcare contexts’. In J. Cutting (ed.) Vague Language Explored Basingstoke: Palgrave

Skelton, J.R., Wearn, A. M., and F.D.R. Hobbs (2002) ‘‘I’ and ‘ we’: a concordancing analysis of doctors and patients use first person pronouns in primary care consultations ’, Family Practice, 19, 5: 484-488

Biber, D. and Conrad, S. (2004) ‘Corpus-Based Comparisons of Registers’, in C. Coffin, A.
Hewings, and K. O’Halloran (eds) Applying English Grammar: Functional and Corpus
Approaches London: Arnold