Tag Archives: English literature

Ulysses Interactive Visualization with scattertext (HDTMT)

How did they make that?

Inspired by the Book review Ulysses by Numbers by Eric Bulson, I have created a visualization of a sentiment analysis of the novel Ulysses. The visualization can be found here. The code for the analysis and the viz plotting is here.

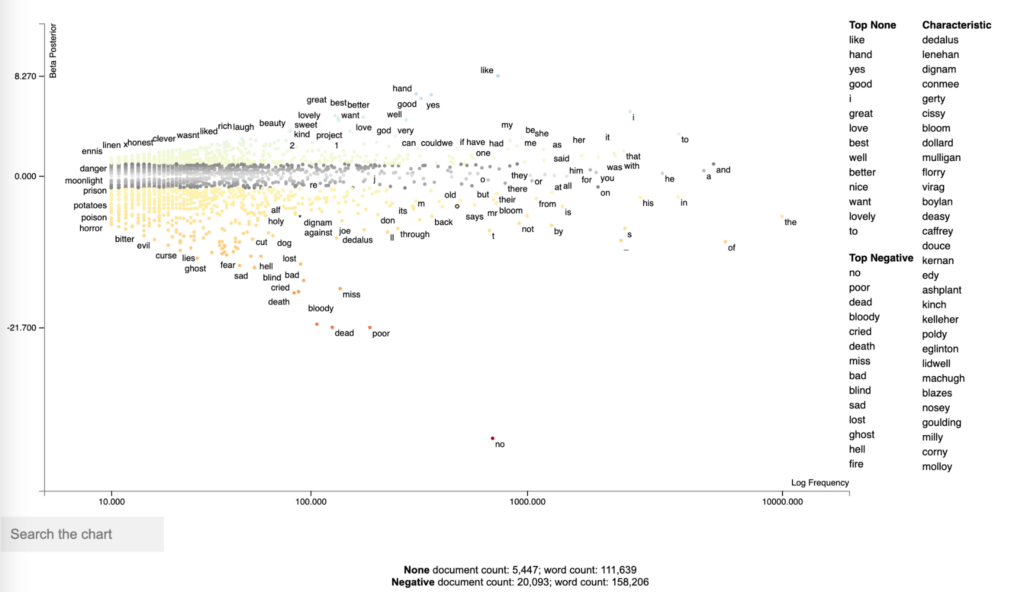
This visualization plots the words based on the frequency (X axis), and shows the top positive and negative words in a sidebar table with related characteristics (adjectives). The Y axis displays a score computed based on the sentiment categories (‘Positive’ and ‘Negative’).

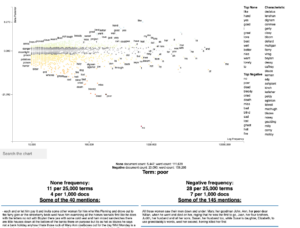
The visualization is interactive, allowing us to search specific words, and retrieve the part of the text where the word occurs.


This HDTMT is intended to show how to run this analysis, and it’s divided into 5 sections, as follows:

  • Downloading and importing Ulysses data
  • Tokenizing data into sentences
  • Perform sentiment analysis
  • Plotting the visualization with scattertext
  • Deploying the html into github pages
  • Next steps and improvements


Downloading and importing Ulysses data

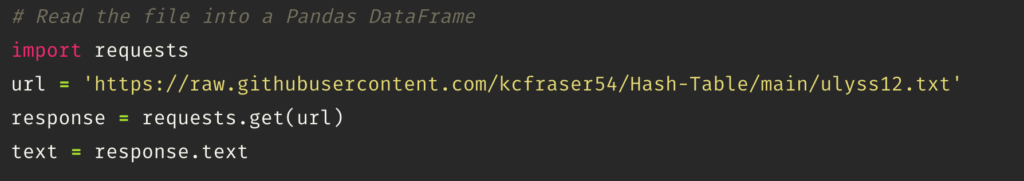
We start by importing “Requests”, the Python library that makes HTTP requests and will connect us to the Github repo where the Ulysses data is stored – here. The data comes from the Gutenberg EBook from August 1, 2008 [EBook #4300], updated on October 30, 2018.


Tokenizing data into sentences

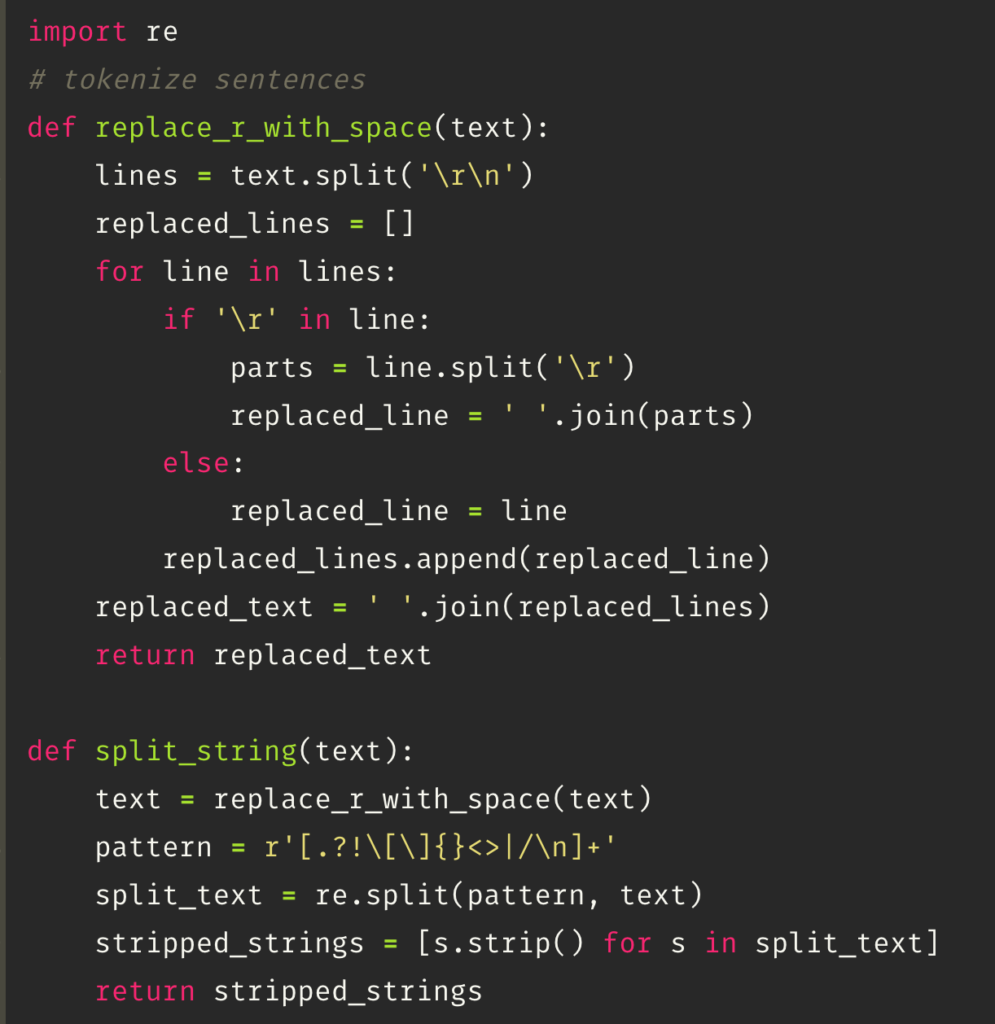
After importing the data, the next step involves cleaning and tokenizing the text into sentences. The data might contain noise such as line breaks (‘\n’) and misplaced line breaks (‘\r’). The function first joins the sentences with misplaced line breaks (‘\r’) to ensure they are connected properly. Then, it tokenizes the text into sentences by splitting the string using ‘\n’, line breaks, and punctuation marks as delimiters. This process ensures that the text is properly segmented into individual sentences for further analysis.


Perform sentiment analysis

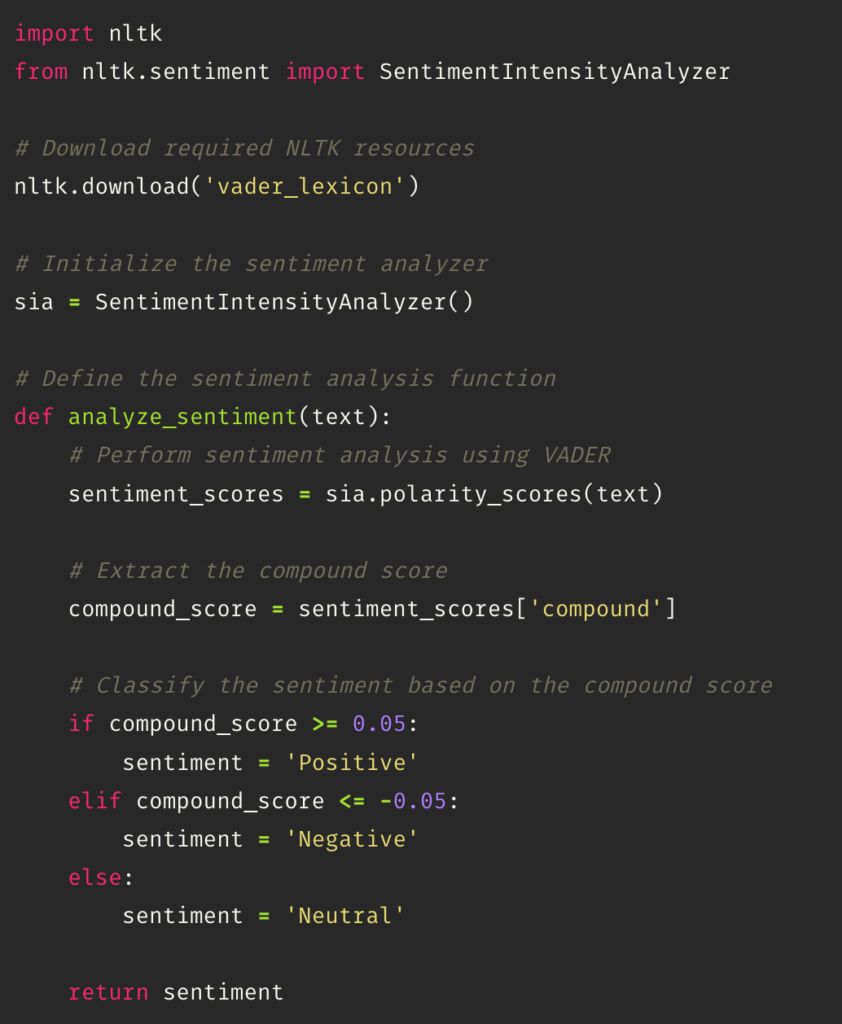
The next step is performing a sentiment analysis that classifies the text into positive, negative, and neutral tone. This task is performed using the class SentimentIntensityAnalyzer from the nltk.sentiment module in NLTK (Natural Language Toolkit). 

The SentimentIntensityAnalyzer uses a lexicon-based approach to analyze the sentiment of text by calculating a compound score. The compound score is an aggregated sentiment score that combines the positive, negative, and neutral scores. The compound score ranges from -1 (extremely negative) to 1 (extremely positive). If the polarity is greater than 0.05 it can be considered positive; lower than 0.05 is negative, and the values in between are neutral. 


Plotting the visualization with scattertext

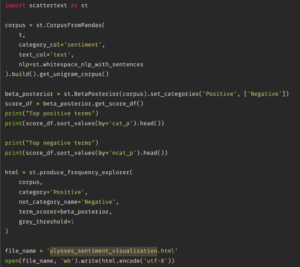
The next step is to import scattertext, a Python library that analyzes and creates an html file. The library receives a specific data type, which is a corpus that is created by using the CorpusFromPandas function. This takes a Pandas DataFrame (t) as input and specifies the category column (‘sentiment’) and text column (‘text’). The whitespace_nlp_with_sentences tokenizer is used for text processing. The corpus is then built, and the unigram corpus is extracted from it.

Then, it creates a BetaPosterior from the corpus to compute term scores based on the sentiment categories (‘Positive’ and ‘Negative’). Next, the get_score_df() method is called to get a DataFrame with the scores. The top positive and negative terms are printed based on the ‘cat_p’ (category posterior) and ‘ncat_p’ (non-category posterior) scores, respectively.

The produce_frequency_explorer function generates an interactive HTML visualization of the corpus. It specifies the corpus, the positive category, the name for the negative category, and the term_scorer as the BetaPosterior object. The grey_threshold parameter sets a threshold for terms to be displayed in gray if they have a score below it.

Finally, the resulting HTML visualization is saved to a file named ‘ulysses_sentiment_visualization.html’ using the open function.


Deploying the html into Github pages

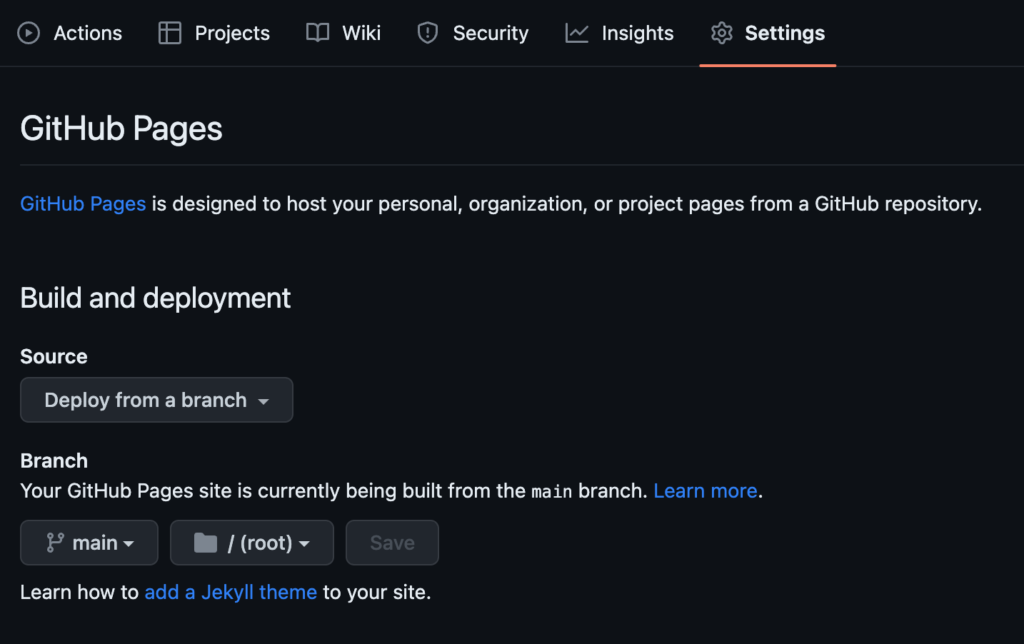
Lastly, we can deploy the html output from the scattertext visualization into a github page. We start by creating a Github repo. Then, uploading the html. Finally, going to settings and changing the deployment source – I’m using from branch, and main/ root in this case.

I’m pointing my Github pages into my alias, livia.work, but you can also use the Github service. This tutorial by professor Ellie Frymire has more details about how to perform the deployment step that can be helpful – here.

Book review: Ulysses by Numbers by Eric Bulson

Bulson, Eric Jon. Ulysses by Numbers. Columbia University Press, 2020. cuny-gc.primo.exlibrisgroup.com, https://doi.org/10.7312/buls18604.

Summary: Eric Bulson employs a quantitative and computational approach to analyze the novel “Ulysses” by James Joyce. His objective is to gain insights into the novel’s structure and themes through the application of statistical methods. By examining the repetitions and variations of numerical patterns within the text, Bulson aims to uncover a deeper understanding of the novel. 

My experience: It was an interesting, but challenging read for me. I did skim through the “Ulysses” by Joyce on multiple occasions, but I never fully immersed myself in its pages. Now, I’m feeling more open to giving it a try at some point in the future. Having that in mind, I mostly focused on understanding the method Bulson used to convey his message.

Eric Bulson is a professor of English at Claremont Graduate University. He got his PhD in English and Comparative Literature from Columbia University. His research interests goes on a range of subjects including Modernism, Critical Theory, Media Studies, World Literature, Visual Storytelling, and British and Anglophone Literature from 1850 to 2000.

Ulysses by Numbers highlights the presence of numeric patterns throughout “Ulysses,” asserting their role in shaping the novel’s structure, pace, and rhythmic flow of the plot. He suggests that Joyce’s deliberate use of numbers is purposeful, enabling him to transform the narrative of a single day into a substantial piece of artwork. Bulson explores the intentionality behind Joyce’s numerical choices, emphasizing how they contribute to the book’s richness and complexity. Additionally, the tone of Bulson’s analysis combines elements of playfulness and exploration, adding an engaging dimension to the discussion.

He emphasizes he will be focused on the “use numbers as a primary means for interpretation“, to make the point that a quantitative analysis is the missing point to compose a “close reading as a critical practice”. He proposed it as an additional method to the traditional literature review that focused on the text.

“Once you begin to see the numbers, then you are in a position to consider how it is a work of art, something made by a human being at a moment in history that continues to recede into the past. We’ll never get back to 1922, but by taking the measurements now, we are able to assemble a set of facts about its dimensions that can then be used to consider the singularity of Ulysses and help explain how it ended up one way and not another.”

Bulson recognizes that literature critique based on computational methods is still under development, and not quite popular yet. The utilization of computers in literary analysis is a relatively modern phenomenon, considering that the majority of such processes were conducted manually until a few centuries ago. The practice of using numbers to elaborate narratives was common until the 18th century in the work of Homer, Catullus, Dante, Shakespeare, and others. However, the rationalism of the upcoming area covered up this practice. Only in the 1960s did the search for symmetry and numerological analysis reemerged, culminating in the method of computational literary analysis (CLA).

Bulson explains that he differs from the usual approach to adapt the use of small numbers in his analysis. Firstly, his analysis is based on samples. It means that instead of analyzing the entire novel the author selects specific sections. Secondly, he recognizes that he applies basic statistical analysis. Despite the simplicity of his analysis, his goal is to make literature more visible. 

In terms of sources, he goes deep into finding the sources of data he considered in this analysis:

“Measuring the length of the serial Ulysses, simple as it sounds, is not such a straightforward exercise. In the process of trying to figure this out, I considered three possibilities: the pages of typescript (sent by Joyce to Ezra Pound and distributed to Margaret Anderson, editor and publisher of the Little Review, in the United States), the pages of the fair copy manuscript (drafted by Joyce between 1918 and 1920 and sold to the lawyer and collector John Quinn), and the printed pages of the episodes in the Little Review (averaging sixty-four per issue).”

It’s interesting to notice how he illustrates his arguments with both handwriting and drawings with graphs and charts, which encompasses the idea of a craftwork mixed with technological visualizations.

In terms of the novel’s structure, Bulson examines the presence of 2’s and 12’s, such as the address “12, rue de l’Odéon” and the year of publication (1922), among other recurring patterns. Additionally, he delves into the number of paragraphs and words in the text, and explores the connections between them. Through one particular analysis, he determines the level of connectivity among the chapters, identifying Chapter 15 as having the highest number of nodes and being the most connected to other chapters, which he refers to as an “Episode.” Chapter 15 consists of 38,020 words and 359 paragraphs. Another significant episode is Chapter 18, which contains the second-highest number of words (22,306) but is condensed into only 8 paragraphs. Chapter 11, on the other hand, has the second-highest number of paragraphs (376) and comprises 11,439 words.

Bulson also examines characters from a quantitative perspective, contrasting the relatively small number of character count in “Ulysses” with other epic works such as “The Odyssey” or “The Iliad.” He uses a visual representation of a network to enhance the understanding of the novel’s scale and structure – highlighting the crowded number of roles in episode 15. 

“Episode 15 arrived with more than 445 total characters, 349 of them unique. If you remove the nodes and edges of episode 15 from the network, Ulysses gets a whole lot simpler . That unwieldy cluster of 592 total nodes whittles down to 235 (counting through episode 14). Not only is a Ulysses stripped of episode 15 significantly smaller: it corresponds with a radically different conception of character for the novel as a whole”.

Moving from the text meta analysis, the authors examine who read the 1922 printed book. Outside of Europe and North America, only Argentina and Australia. In the US, the book was most popular in the West Coast. In the following chapter, he tries to answer when Ulysses was written. He mentioned that the traditional answer is that Joyce began writing the novel in 1914 and finished it in 1921. However, he points out that this is such a simplistic answer. He argues about the nonlinearity of the written process, more fluid and organic, and less structured.

In the final chapter, the author goes back to the content analysis, bringing a reflection that could retreat himself “after reducing Ulysses to so many sums, ratios, totals, and percentages, it’s only fair to end with some reflection on the other inescapable truth that literary numbers bring: the miscounts”. He refers as “miscounts” any bias or issues in terms of data collection of analysis.However, he defends the method by saying that literary criticism is not a hard science, and imprecisions, vagueness and inaccuracy is actually part of the process. Also, theories based on small samples are popular in historical and social analysis, and his work should not be discredited because of that. 

“Coming up against miscounts has taught me something else. Far from being an unwelcome element in the process, the miscounts are the expression of an imprecision, vagueness, and inaccuracy that belongs both to the literary object and to literary history. In saying that, you probably don’t need to be reminded that literary criticism is not a hard science with the empirical as its goal, and critics do not need to measure the value of their arguments against the catalogue of facts that they can, or cannot, collect.”

After reviewing the contribution of his perspective, he concludes that “readers might to bridge the gap, Ulysses will remain a work in progress, a novel left behind for other generations to finish. Reading by numbers is one way to recover some of the mystery behind the creative process.”

HDTMT: Locating the beautiful, picturesque, sublime and majestic

Locating the beautiful, picturesque, sublime and majestic: spatially analysing the application of aesthetic terminology in descriptions of the English Lake District

https://doi.org/10.1016/j.jhg.2017.01.006

Authors/Project Team:
Christopher Donaldson – Lancaster University
Ian N. Gregory – Lancaster University
Joanna E. Taylor – University of Manchester

WHAT IT IS

An investigation of the geographies associated with the use of a set of aesthetic terms (“beautiful,” “picturesque,” “sublime,” and “majestic”) in writing about the English Lake District, a region in the northwest of England with a long and prestigious history of representation in English-language travel writing and landscape description, notably in the 18th and 19th centuries. The Lake District has been a particular focus within the field of spatial humanities for well over a decade, motivated in part by “an awareness of the braided nature of the region’s socio-spatial and cultural histories; and an understanding of this rural, touristic landscape as a repeatedly rewritten and imaginatively overdetermined space” (Cooper and Gregory 90).

Focusing on the four aforementioned terms, which exemplify a new language of landscape appreciation emerging in late 18th century British letters, Donaldson and his co-authors intend to “demonstrate what a geographically orientated interpretation of aesthetic diction can reveal about the ways regions like the Lake District were perceived in the past” (44).

Through this case study, the authors introduce the method of “geographical text analysis,” which they locate at the nexus of aesthetics, physical geography, and literary study. The project combines corpus linguistics with geographic information systems (GIS) in a novel fashion.

Primary Data Source:

  • Corpus of Lake District Writing, 1622-1900 (Github)

The corpus contains 80 manually digitized texts totaling over 1.5-million word tokens.

Natural language processing (NLP) techniques were used to identify place names and assign these names geographic coordinates—a method called “geoparsing.” But the project members also went beyond what was possible at the time with out-of-the-box NLP libraries and geoparser tools in order to deeply annotate the texts, linking place-name variants and differentiating a wide range of topographical features. As such, the corpus “forms a challenging testbed for geographical text analysis methods” (Rayson et al.).

What you’d need to know to conduct “geographical text analysis”:

Step 1: Geoparsing

If your corpus is not already annotated, you will need to “geoparse”—convert place-names into geographic identifiers.

Geoparsing involves two stages of NLP:

  • Named Entity Recognition (NER) – a method for automatically extracting placenames from text data
  • Named Entity Disambiguation (NED) – a method for linking the extracted and identified terms with existing knowledge, enabling cross-referencing and connections to metadata such as geo-spatial information.

Tools:

Step 2: Collocation analysis.

The authors go about identifying the specific geographies associated with “beautiful,” “picturesque,” “sublime,” and “majestic” by noting when those terms appear alongside placenames. Thus, the authors develop a dataset of placename co-occurrences or “PNCs” extracted from their corpus. They then assess the frequency of co-occurrence to determine the statistical significance of the association between a given place and one of the aesthetic terms.

Tools:

Step 3: Spatial analysis

With the statistically significant PNCs identified, the authors use geoparsing tools to assign latitude/longitude (mappable) coordinates to each PNC. This enables researchers to analyse the spatial distribution of PNCs through GIS software such as ArcGIS, creating standard dot maps as well as density-smoothed maps. They also use Kulldorf’s Spatial Scan Statistic (traditionally an epidemiological statistic) to identify clusters.

With sophisticated GIS, they can map the spatial coordinates of the PNCs onto topographical and geological datasets, enabling a rich understanding of how places described as “majestic,” for example, map onto different elevations or different geological formations.

Digital terrain models (DTMs) or Digital Elevation Models (DEM) are vector and raster maps that can be imported into GIS tools if they are not already included. National geological surveys provide geology data in the form of GIS line and polygons that can be matched with PNC spatial metadata.

Tools:

Results

Donaldson et al.’s geographic analysis yields some striking findings on how the four aesthetic terms are applied to the Lake District landscape, which the authors summarize thusly:

As we have seen, whereas beautiful and, more especially, picturesque are often associated with geographical features set within, and framed by, their environment, majestic is more typically associated with features that rise above or extend beyond their surroundings. Sublime, true to Burke’s influential conception of the term, stands apart from these other terms in being associated with formations that are massed together in ways that make them difficult to differentiate […] The distinctive geographies associated with the terms beautiful and picturesque, on the one hand, and majestic and sublime, on the other, confirm that the authors of the works in our corpus were, as a whole, relatively discerning about the ways they used aesthetic terminology.

(Donaldson et al. 59)

References Cited:

Cooper, David, and Ian N. Gregory. “Mapping the English Lake District: A Literary GIS.” Transactions of the Institute of British Geographers, vol. 36, no. 1, 2011, pp. 89–108.

Donaldson, Christopher, et al. “Locating the Beautiful, Picturesque, Sublime and Majestic: Spatially Analysing the Application of Aesthetic Terminology in Descriptions of the English Lake District.” Journal of Historical Geography, vol. 56, Apr. 2017, pp. 43–60. ScienceDirect, https://doi.org/10.1016/j.jhg.2017.01.006.

Rayson, Paul, et al. “A Deeply Annotated Testbed for Geographical Text Analysis: The Corpus of Lake District Writing.” Proceedings of the 1st ACM SIGSPATIAL Workshop on Geospatial Humanities, Association for Computing Machinery, 2017, pp. 9–15. ACM Digital Library, https://doi.org/10.1145/3149858.3149865.